

Education · June 16, 2026 · Education Team
How to Read Candlestick Patterns on CFD Charts
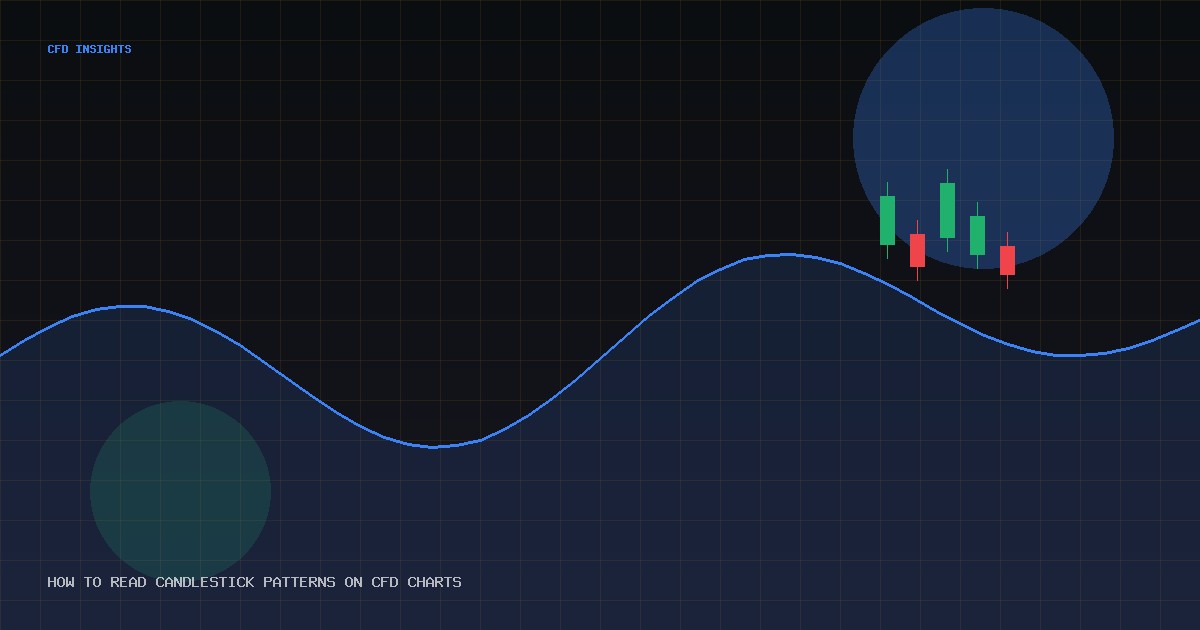
Candlesticks reveal market sentiment in a single glance. Learn the patterns CFD traders use most often on forex and index charts.
Each candlestick shows open, high, low, and close for a chosen timeframe. Bullish candles (close above open) and bearish candles (close below open) help you spot shifts in control between buyers and sellers.
Common patterns include pin bars at support, engulfing candles at range extremes, and inside bars before breakouts. Always confirm patterns with context — trend, volume proxy, and higher-timeframe structure.
Starter patterns
- Hammer / shooting star at key levels
- Bullish and bearish engulfing
- Morning star / evening star reversals